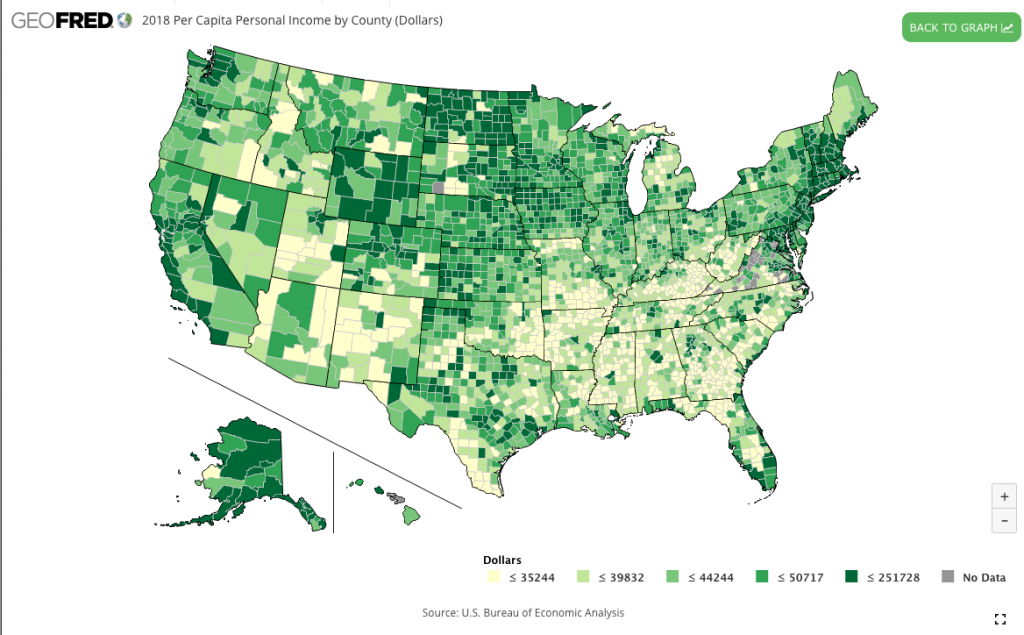
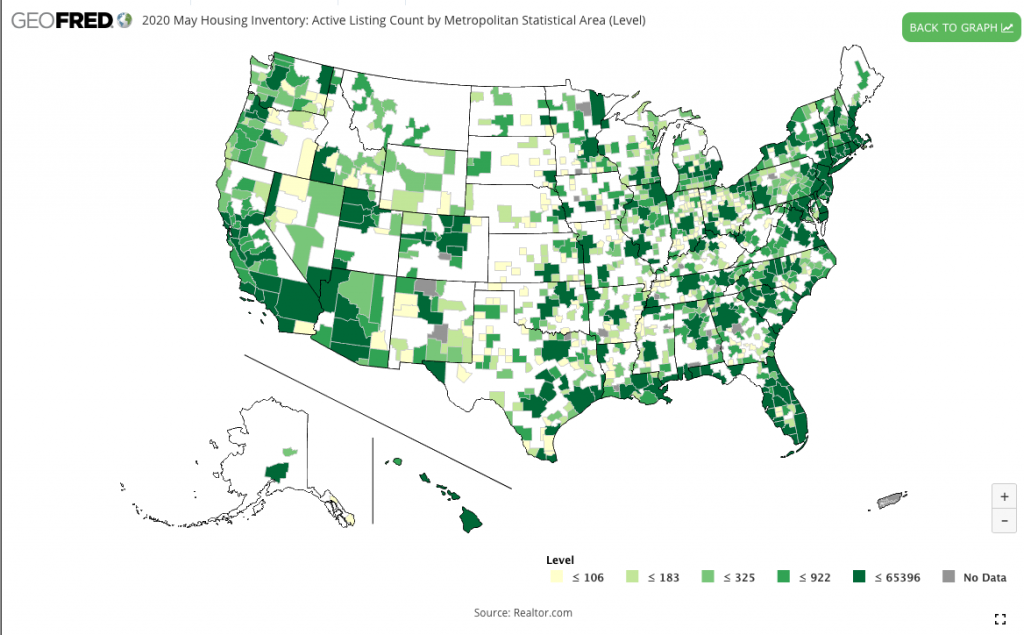
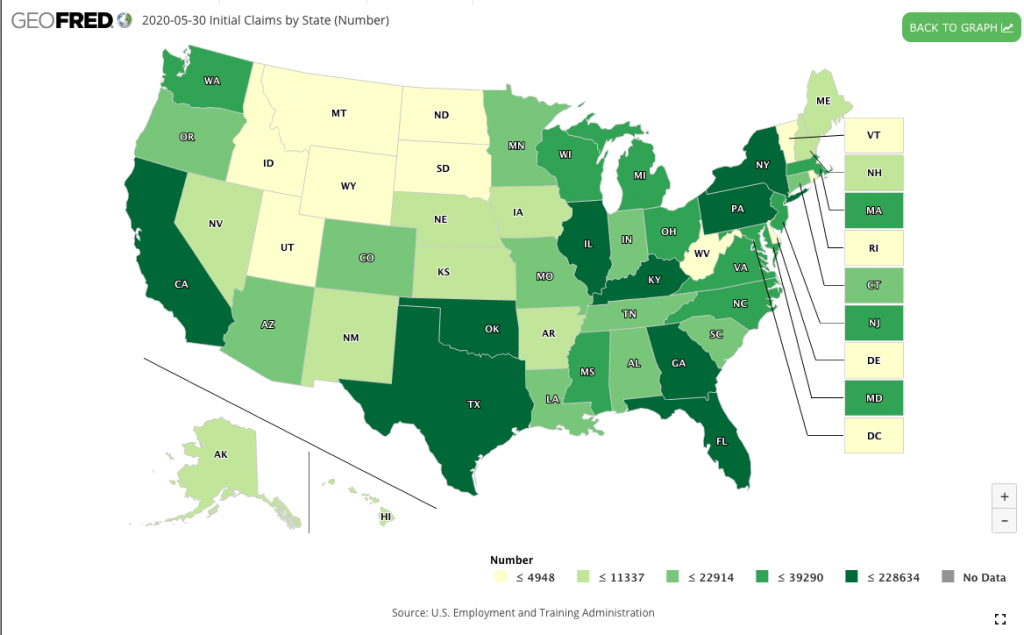
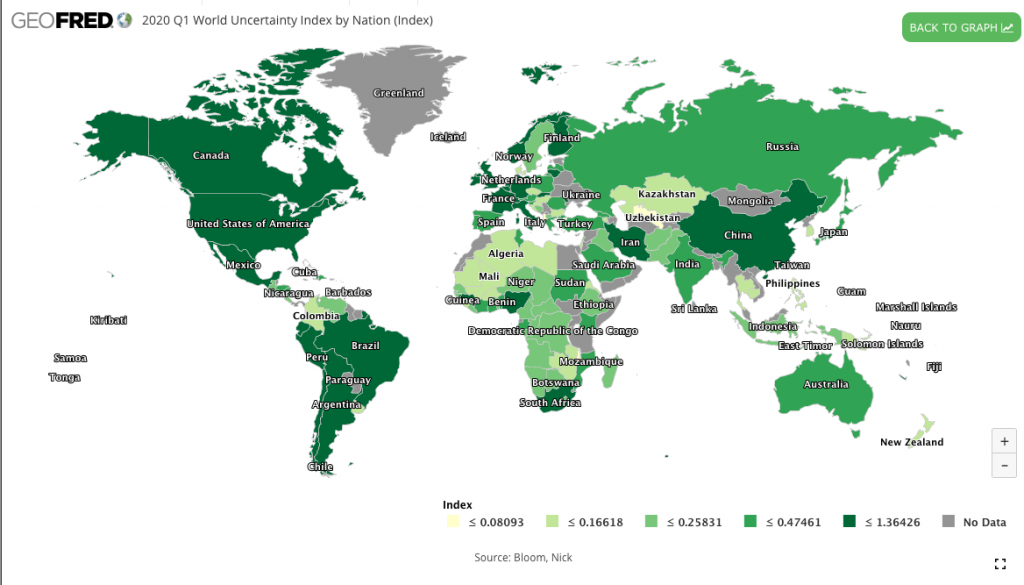
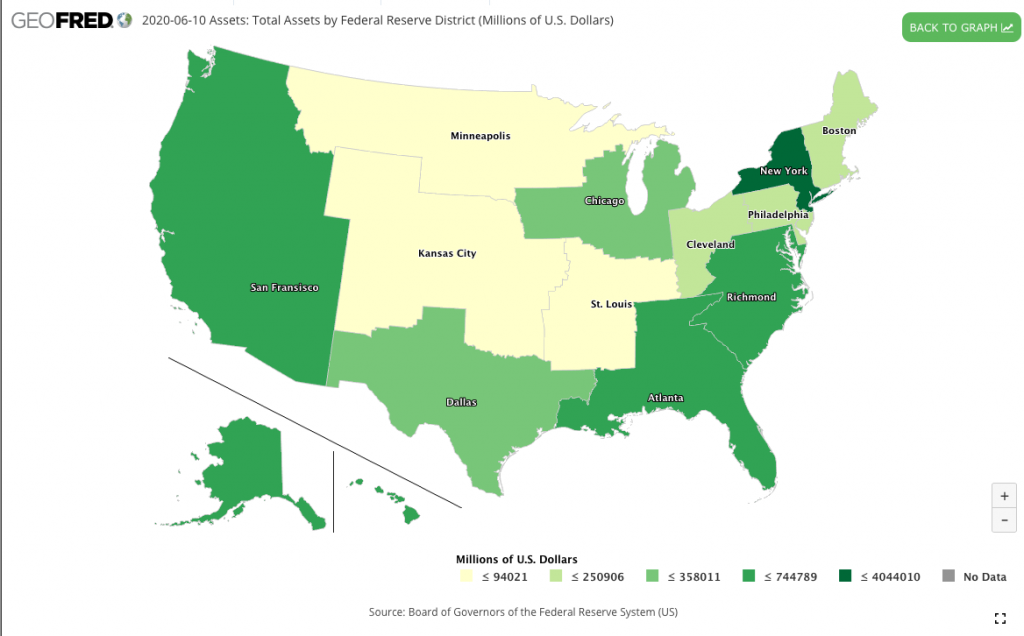
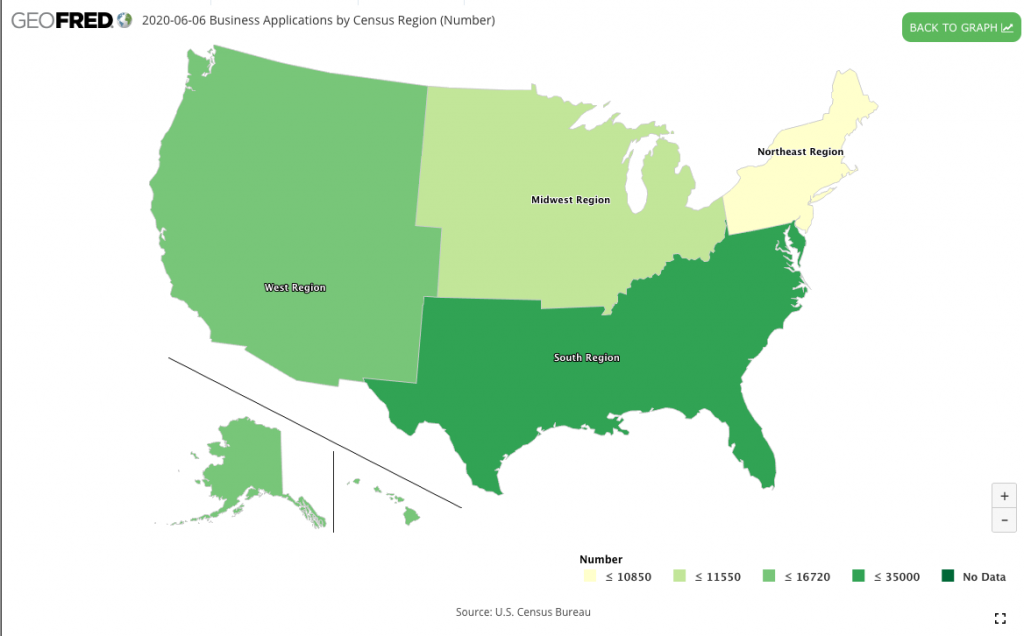
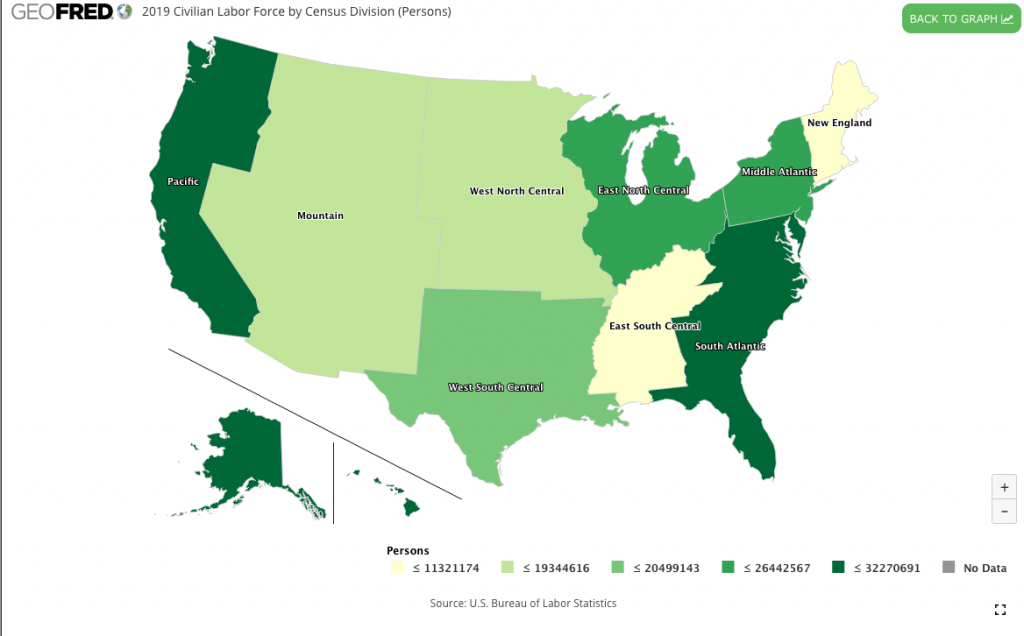
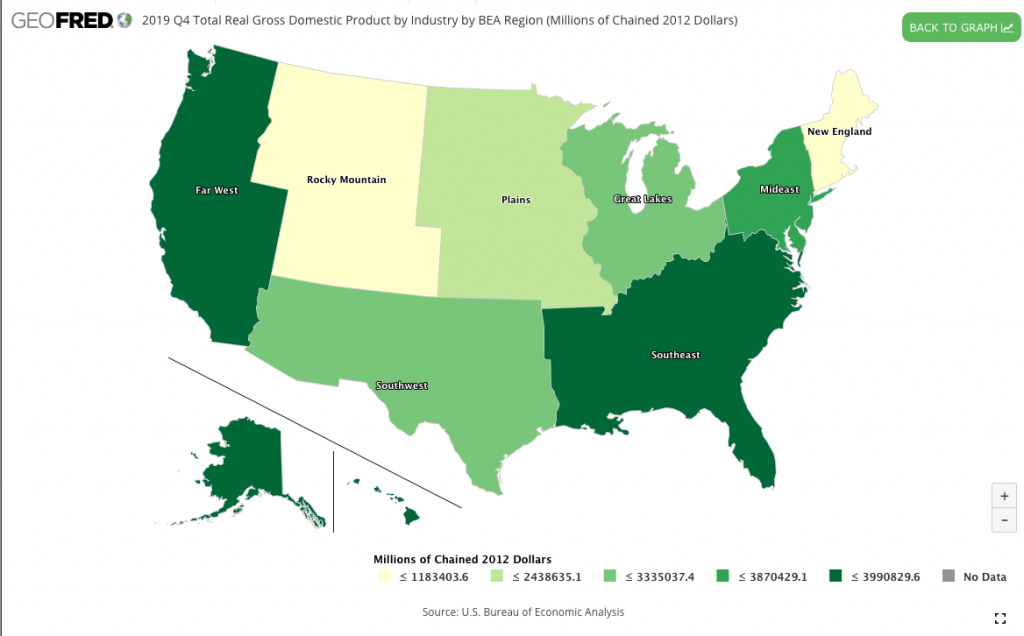
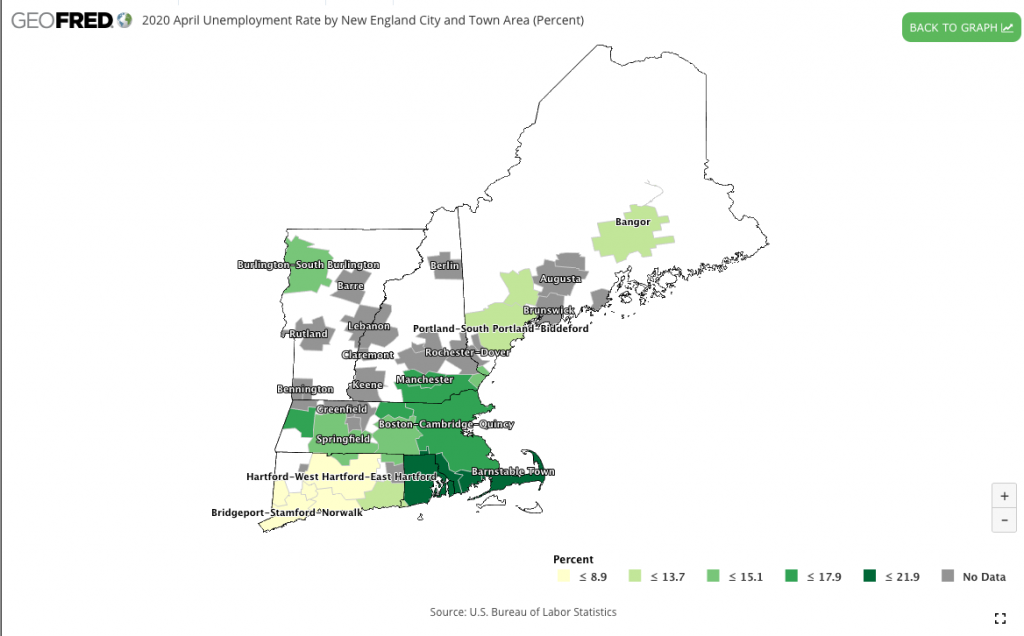
To help place FRED in the center of your data world, the FRED Team has launched a new map feature for data series with geographic characteristics. Simply click the green VIEW MAP button on the upper right side of the graph to see the big picture.
These interactive maps have zooming, mouse-over, and full screen functions. They provide a cross-sectional perspective, rather than just a time-series form, that lets you compare regions. Reach all the advanced mapping features from the EDIT MAP button.
The EDIT MAP button takes you to our existing GeoFRED site with established tools, such as downloading data, modifying map colors, and creating custom legends.
Explore FRED’s 9 types of maps…