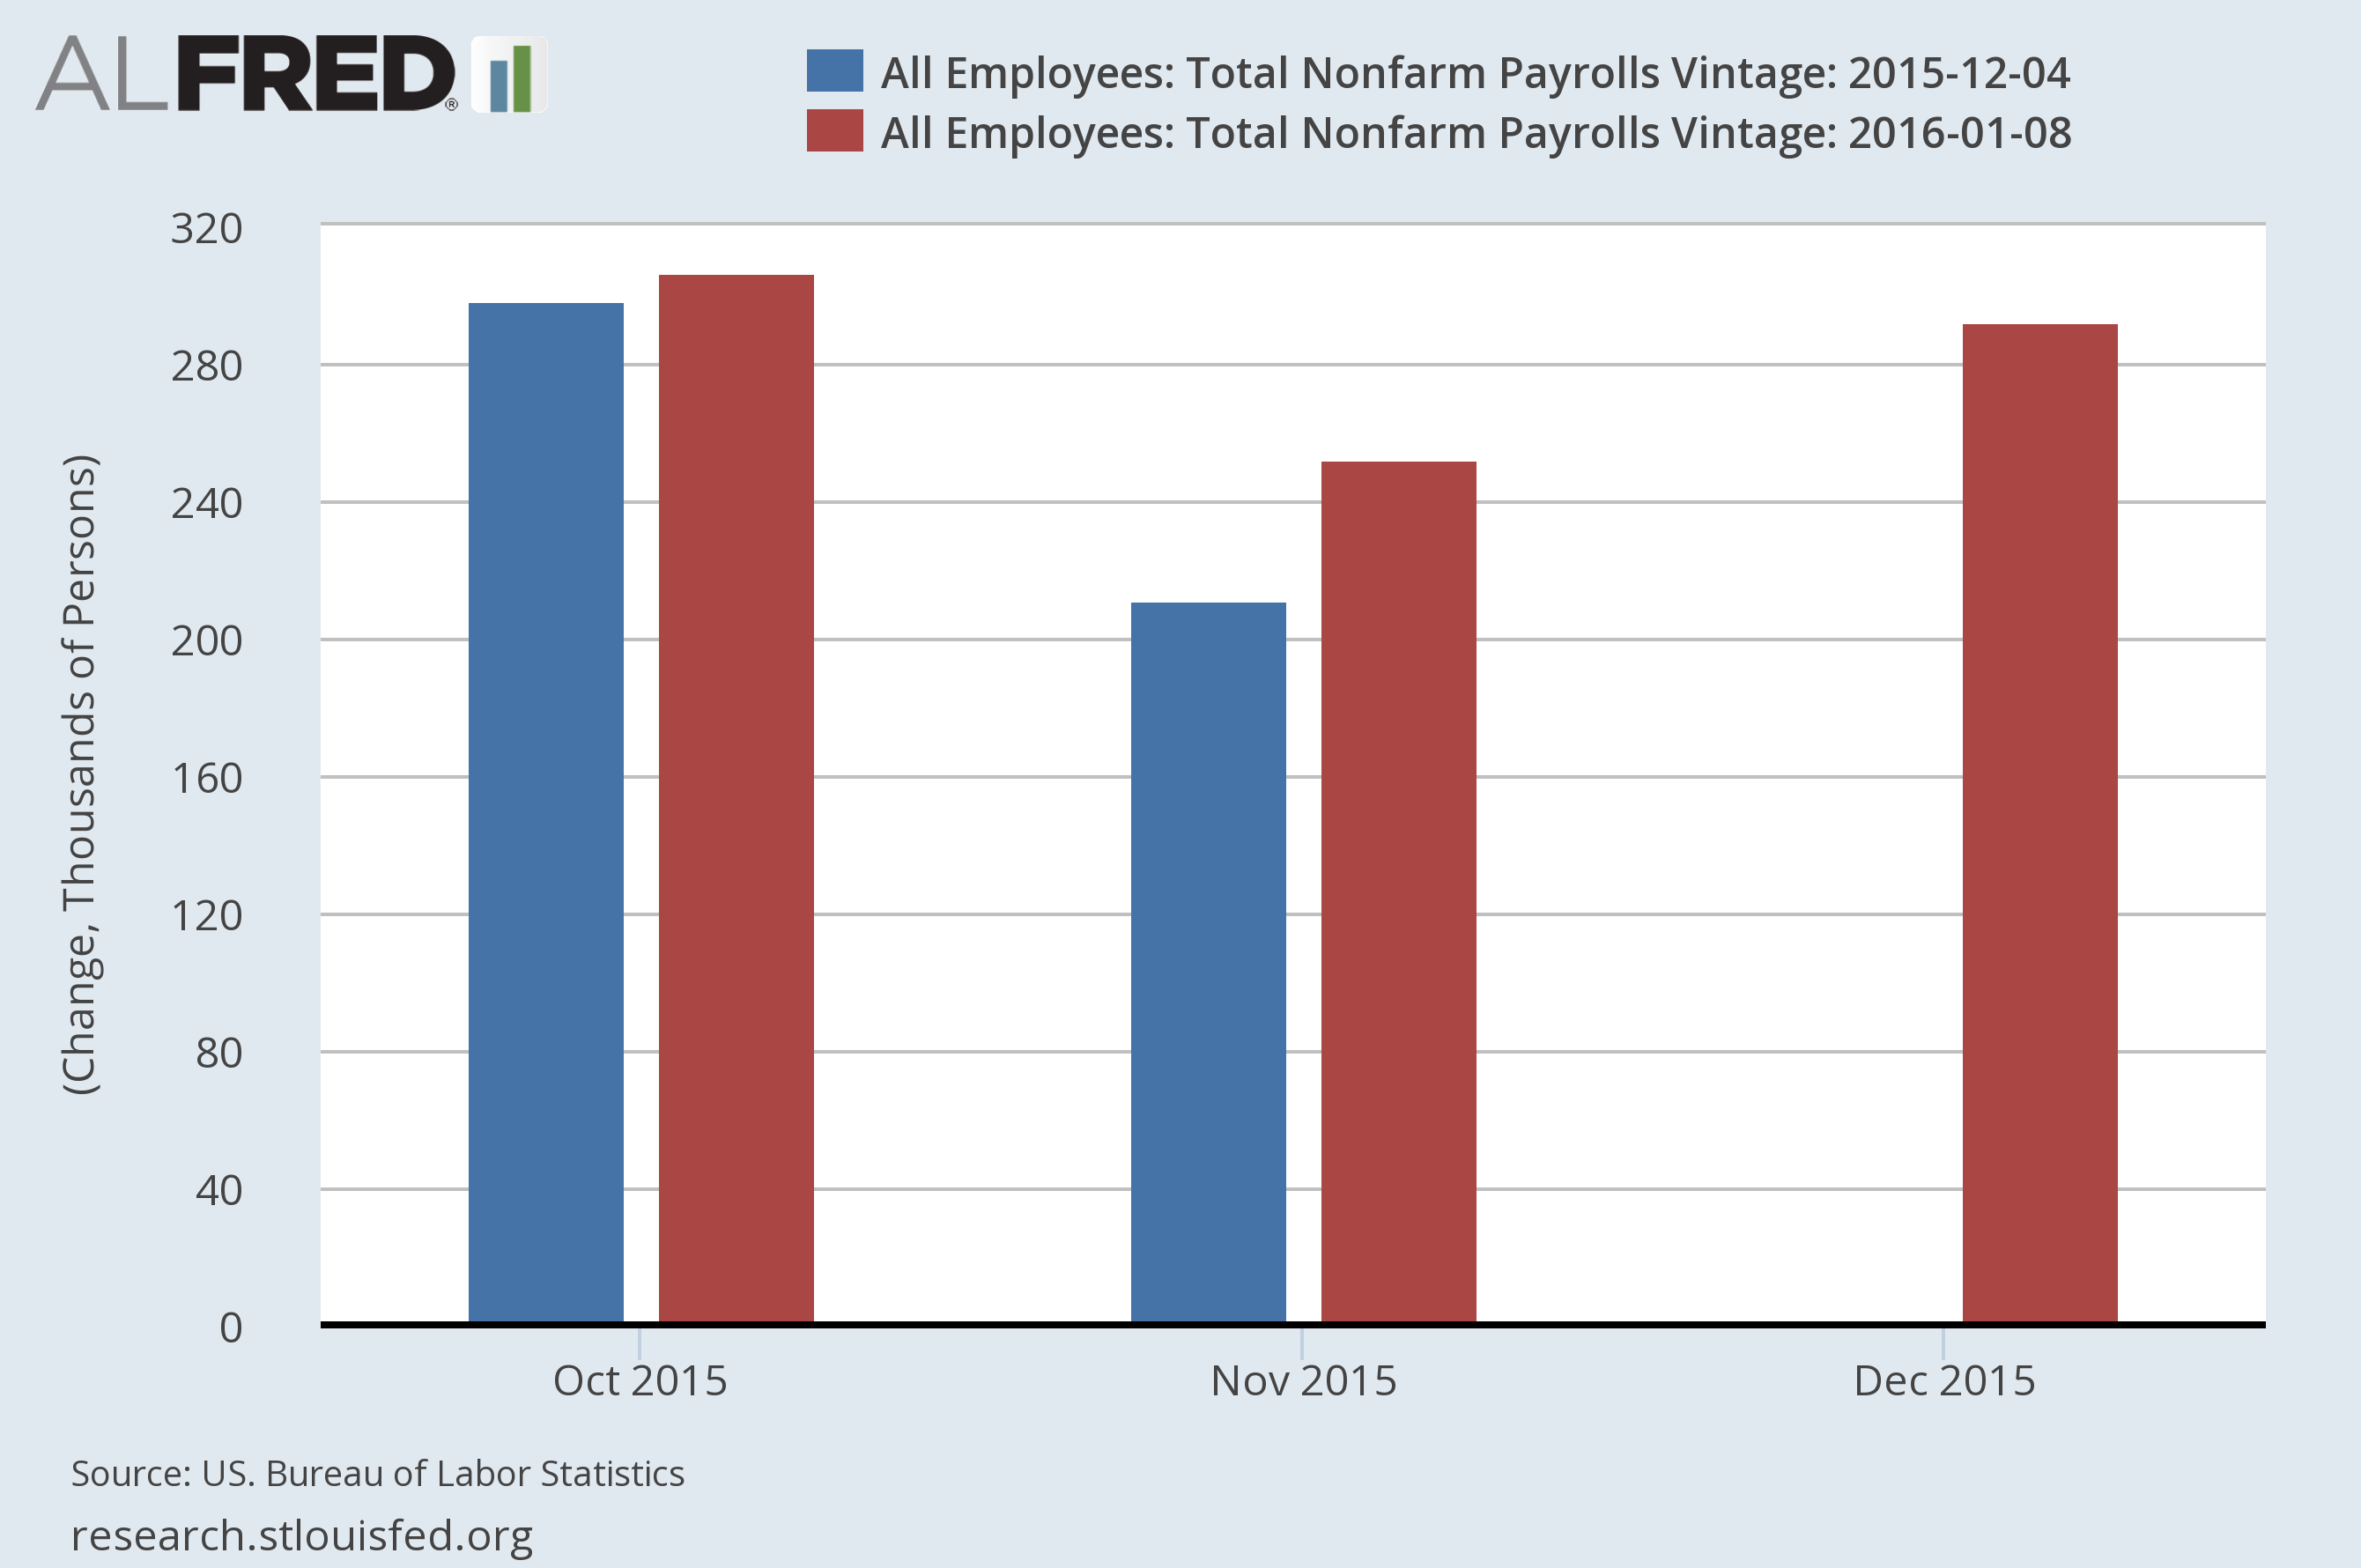
In a display of brotherly love and/or sibling rivalry, ALFRED has embraced the same interface as his younger brother FRED. Now, if you know how to use FRED to visualize and download the latest data, you know how to use ALFRED to visualize specific vintages of those data. For example, you can quickly build this graph in ALFRED to see revisions to Total Nonfarm Payrolls.
Federal Reserve Economic Data
ALFRED and FRED: Closer Than Ever
Posted on January 28, 2016
Posted in FRED Announcements, Research Announcements

