
In this newsletter, we use a graph to highlight the changes in the components of GDP over time, map GDP by nation, and quiz you on the components of GDP in the U.S., Japan, and Germany. We also introduce our forecasting game, FREDcast.
How do the components of GDP change over time?
This assignment provides instructions on building the graph below and provides suggested writing prompts for out-of-class assignments.
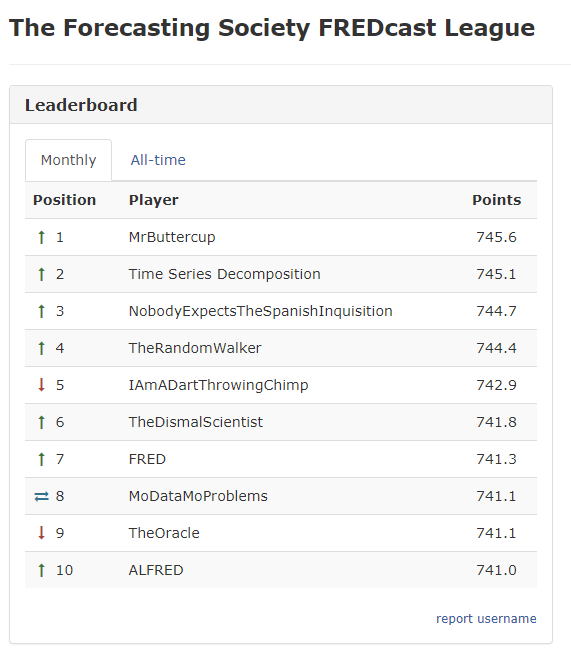
Teach economics with FREDcast, the forecasting game the whole class can play!
FREDcast is a free, interactive forecasting game in which your students make forecasts for four economic releases: GDP, inflation, employment, and unemployment. Forecasts must be submitted by the 20th of the current month. As the data are realized, league and student results are automatically updated. Higher scores reflect greater accuracy over time. You can set up forecasting leagues for your classes. This short video explains how to create a league. The full instructions and FAQs are available here.
Help your students become better GDP forecasters by diving into the data. Here are resources to get you started.
Where will the data take you? Use maps to teach economic concepts.
Click the map to answer the question:
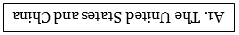
Q1: Which two countries have a GDP larger than $10 trillion?
Click the map to answer the question:
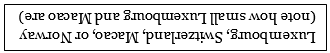
Q1: Name two countries with a GDP per capita larger than $70,000.
This assignment provides instructions on creating the maps above and provides suggested prompts for in-class discussion.
Quiz yourself on the GDP components of several countries
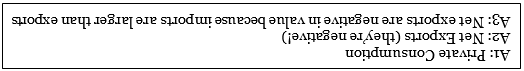
Q1: Which GDP component is largest in value?
Q2: Which GDP component is smallest in value?
Q3: Why are net exports negative in value?
Q1: Which GDP component is larger in value, private investment or government spending?

Q1: Why are net exports positive in value?
Now that you’ve taken (and hopefully passed) this quiz, use this dashboard to quiz your students in class.