FRED has added four weekly series on retail trade from the Federal Reserve Bank of Chicago. The Chicago Fed Advance Retail Trade Summary (CARTS) is a weekly index designed to track the Census Bureau’s Monthly Retail Trade Survey (MRTS).
This assignment provides instructions on building the graph below and includes writing prompts for out-of-class assignments.
This assignment provides instructions on creating the map below and suggests prompts for in-class discussion. See how you do on our sample discussion question below.
Click on the map above to view an interactive version.
Question: Name the state with the highest labor productivity growth during 2020. Don’t overlook Hawaii and Alaska!
Index Numbers: Learn how to use several FRED® features to use index numbers to measure growth in prices: changing the data units and applying a formula to the data. The FRED Interactive modules can be embedded in your learning management system.
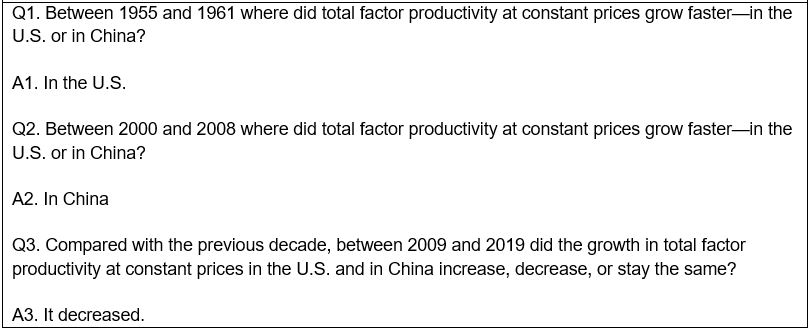
Q1. Between 1955 and 1961 where did total factor productivity at constant prices grow faster—in the U.S. or in China?
Q2. Between 2000 and 2008 where did total factor productivity at constant prices grow faster—in the U.S. or in China?
Q3. Compared with the previous decade, between 2009 and 2019 did the growth in total factor productivity at constant prices in the U.S. and in China increase, decrease, or stay the same?
Q1. Between 1988 and 2008 where did labor productivity grow faster—in the durable or in the non-durable manufacturing sector?
Q2. Compared with the years between 1988 and 2008, between 2009 and 2019 did labor productivity in both durable and non-durable manufacturing increase, decrease, or stay the same?
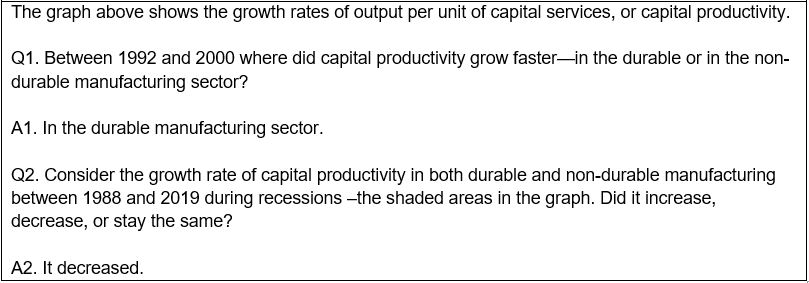
The graph above shows the growth rates of output per unit of capital services, or capital productivity.
Q1. Between 1992 and 2000 where did capital productivity grow faster—in the durable or in the non-durable manufacturing sector?
Q2. Consider the growth rate of capital productivity in both durable and non-durable manufacturing between 1988 and 2019 during recessions –the shaded areas in the graph. Did it increase, decrease, or stay the same?
Now that you’ve aced this quiz, give it to your students using this dashboard. To customize this dashboard, just click the “Save to My Account” button at the top of the dashboard.
FRED has 13 new series of overnight interest rate data from the Bank of England. Banks pay the sterling overnight index average (SONIA) on top of any loans made for purchases of sterling (British pounds) in the overnight market. Because SONIA is based on the average of these overnight interest rates without incorporating risk premiums, it is also effectively risk free. This is a departure from the London interbank offered rate (LIBOR), which is still short-term lending but more forward looking; since LIBOR includes loans up to one year in duration, risk premiums are built into some of its loans. LIBOR historically has been used by the private sector as a benchmark for short-term interest rates; but as the Bank of England phases out LIBOR this year, SONIA will take its place as a more robust and stable benchmark.
Effective July 29, 2021, the Board of Governors of the Federal Reserve System will replace the interest rate on excess reserves (IOER) and the interest rate on required reserves (IORR) with a single rate, the interest rate on reserve balances (IORB). Therefore, FRED has discontinued the IOER and the IORR rates and added the IORB rate. See the Board’s announcement for more details.
The IORB rate is the rate of interest that the Federal Reserve pays on balances maintained by or on behalf of eligible institutions in master accounts at Federal Reserve Banks. The interest rate is set by the Board of Governors, and it is an important tool of monetary policy. See Policy Tools and IORB FAQs for more information.
FRED has 20 new series of summary statistics from “The Effects of the 1930s HOLC ‘Redlining’ Maps,” which is a recently updated working paper (August 2020) by Daniel Aaronson, Daniel Hartley, and Bhash Mazumder of the Chicago Fed.
These authors study the effects of the 1930s-era HOLC “redlining” maps on the long-run trajectories of neighborhoods. They calculate summary statistics based on U.S. Census estimates for each area matched to the geocoded HOLC neighborhoods. These neighborhoods are based on the geocoded renderings of the original Home Owners Loan Corporation (HOLC) maps for 149 cities.
FRED has added over 19,500 new series on industry productivity from the Bureau of Labor Statistics. This dataset includes series from the following labor and multifactor productivity press releases:
Dear FREDcast players,
Thank you for being a part of our FREDcast community. We’ve enjoyed all the great economic forecasting over the past 5 years.
After carefully assessing regular usage and the resources we must commit to supporting this product, we have decided to discontinue FREDcast.
The June forecasting period (from May 21, 2021, until June 20, 2021) will be the last one to enter your forecasts. The scoring of forecasted values will occur on July 2, 2021, for unemployment rate and payroll employment; on July 13, 2021, for CPI inflation; and on July 29, 2021, for the real GDP growth rate.
The FREDcast website will be unavailable after August 1, 2021.
We know a change like this can be disruptive, especially for those who have used FREDcast as a teaching tool. We’d like to suggest some alternatives to engage your students with current events and FRED data.
As always, thank you for your continued trust in the economic resources from the Federal Reserve Bank of St. Louis.
These 10 index series from Andrew Davidson & Company (AD&Co) track the total return of the bonds issued within the CRT programs of Fannie Mae and Freddie Mac. The U.S. Mortgage High Yield Indexes is an informational, investment-oriented monthly index of the return components: price, coupon, paydown, and credit loss. Accompanied by standard risk metrics from their models, the index is useful for comparisons with individual CRT bonds or relative value to other credit markets.
The crOAS (credit-and-option-adjusted spread) series are an extension of the traditional OAS measure. On a set of 20 standardized, probabilistically weighted, market-and-model stress scenarios, AD&Co computes a discount rate that equates expected present value of a tranche’s cash flows to the observed market price; the cash flows are loss-adjusted using AD&Co’s LoanDynamics Model (LDM).
Disclaimer: The AD&Co U.S. Mortgage High-Yield Index serves as an informational index and is not for commercial-use purposes. The Index’s accuracy, completeness, timeliness, and suitability for any purpose are not guaranteed. The Index does not constitute (1) investment, legal, accounting, tax, or other professional advice or (2) any recommendation or solicitation to purchase, hold, sell, or otherwise deal in any investment. This Index has been prepared for general informational purposes, without consideration of the circumstances or objectives of any particular investor. Any reliance on the Index is at the reader’s sole risk. All investment is subject to numerous risks, known and unknown. Past performance is no guarantee of future results. For investment advice, seek a qualified investment professional. Not for redistribution without permission. Note: An affiliate of Andrew Davidson & Co., Inc. engages in trading activities in investments that may be the same or similar to those featured in the Index.
The Federal Reserve Bank of Chicago has announced they will discontinue the Midwest Economy Index (MEI) after its June 2021 release, given the discontinuation of several underlying data series and the impact the COVID-19 pandemic has had on the remaining series since March 2020.
The MEI release will continue to be updated regularly on FRED for the two remaining release dates, May 28 and June 30, 2021.
More information about the discontinuation of the MEI is available on the Chicago Fed’s MEI home page.
FRED has added the Brave-Butters-Kelley Indexes (BBKI), a research project from the Federal Reserve Bank of Chicago. The BBK Coincident and Leading Indexes and Monthly GDP Growth for the U.S. are constructed from a large panel of monthly measures of real economic activity and quarterly real GDP growth. Monthly GDP growth is indexed to the quarterly estimates from the U.S. Bureau of Economic Analysis and consists of three components: cycle, trend, and irregular components.
Explore the monthly and quarterly BBK indexes in FRED here.