FRED has expanded job posting data from Indeed. The release now features trends in job postings for France and several new metro areas in the U.S.
Indeed has discontinued wage-tier posting data, and these data will no longer be updated on FRED. Indeed has also modified their release methodology significantly.
These data are copyrighted and require pre-approval: Contact Indeed to request permission to use the data.
The U.S. Census Bureau has updated their Business Formation Statistics (BFS) release, and FRED now includes new monthly data starting in July 2004 (including new data for U.S. Census regions and national data by two-digit NAICS codes).
Quarterly data have been discontinued and replaced with similar monthly data. These monthly series can be found within the notes of the quarterly series. FRED also allows aggregation of data through the “Edit Graph” panel’s “Modify frequency” menu.
The BFS release
provides timely and high-frequency data on business applications and employer business formations
measures business initiation activity (Business Application Series) as indicated by applications for an employer identification number (EIN) on the IRS Form SS-4
provides information on actual and projected employer business formations that originate from these applications, based on the record of first payroll tax liability for an EIN
contains measures of delay in business starts as indicated by the average duration between the application for an EIN and the transition to an employer business
FRED has added about 120 series on weekly historical balance sheet records for the Federal Reserve System, starting in 1914 and spanning through April 2018. These series were digitized by Cecilia Bao, Justin Chen, Nicholas Fries, Andrew Gibson, Emma Paine, and Kurt Schuler in their working paper “The Federal Reserve System’s Weekly Balance Sheet Since 1914,” issued jointly with the Center for Financial Stability.
The Fed’s balance sheet line items evolve over time: Some aggregates do not appear in all of the historical press releases or stop being included after a certain date. The authors continue to calculate these series based on their subcomponents.
Details on the authors’ calculations and links to the corresponding series in the H.4.1 Factors Affecting Federal Reserve Balances statistical release from the Board of Governors are available in the relevant series notes under the individual FRED graphs.
FRED has added about 18,500 new series from the Bureau of Labor Statistics’ Consumer Expenditure Surveys (CE) program. The CE program provides data on expenditures, income, and demographic characteristics of consumers in the United States, which are primarily used to revise the relative importance of goods and services in the market basket of the consumer price index.
The CE surveys collect data that fall into one of the following major expenditure categories:
alcoholic beverages
apparel and services
cash contributions
education
entertainment
food
healthcare
housing
miscellaneous
personal care products and services
personal insurance and pensions
reading
tobacco products and smoking supplies
transportation
The expenditure data and demographic and income information are provided in a variety of formats, including tables with estimates by region, income, age, race, education, occupation, and various other characteristics of the household or reference person. CE also provides tables that cross-tabulate using two characteristics (e.g., age and income) to allow users to further analyze the spending behavior for a particular subset of the population.
Focus on Employment Changes Across Educational Attainment Groups
This assignment provides instructions on building the graph below and includes writing prompts for out-of-class assignments.
Using GeoFRED® to Compare Educational Attainment and Unemployment Rates
This assignment provides instructions on creating the maps below and suggests prompts for in-class discussion. See how you do on our sample discussion question below.
Click on the map above to view an interactive version.
Again, click on the map above to view an interactive version Question: Compare both maps. What differences or similarities do you see between educational attainment and unemployment across geographical areas in the U.S.?
Learning About the Economics of Education to Forecast Changes in Payroll Employment
In December 2020, the total number of workers on payrolls decreased. Read on for more details and a list of resources to become a better FREDcast forecaster.
BLS Headline:
According to the Bureau of Labor Statistics, “Total nonfarm payroll employment declined by 140,000 in December (2020).”
Q1. As of the second quarter of 2020, which population group had the second-highest median weekly income level?
Q2. As of the second quarter of 2020, which population group had the lowest median weekly income level?
Q1. As of November 2020, which population group had the lowest participation rate in the civilian labor force?
Q2. As of November 2020, which population group had the highest participation rate in the civilian labor force?
Q1. Between 2000 and 2020, which population groups had the most constant unemployment rates?
Q2. Between 2000 and 2020, which population groups experienced the largest changes in unemployment rates?
Now that you’ve aced this quiz, give it to your students using this dashboard. To customize this dashboard, just click the “Save to My Account” button at the top of the dashboard.
These state-level data include initial claims for unemployment assistance for workers impacted by the COVID-19 pandemic (including those workers who are not ordinarily eligible for unemployment benefits), as well as continued claims for unemployment assistance and emergency unemployment compensation for these workers.
More details about the data and the expanded eligibility requirements are available from the Department of Labor’s FAQs for unemployment insurance relief.
The U.S. Census Bureau has released an experimental data product featuring modeled state-level retail sales. The Monthly State Retail Sales (MSRS) report is a blended data product that combines monthly retail trade survey data, administrative data, and third-party data. Users are encouraged to view the MSRS methodology for more information on how the Census constructs the data.
These 624 series represent year-over-year percent changes for total retail sales excluding nonstore retailers as well as 11 North American Industry Classification System (NAICS) retail subsectors. The available release table provides a view for geographic and industry comparison, and all state-level data are available in GeoFRED.
This assignment provides instructions on building the graph below and includes writing prompts for out-of-class assignments.
Using GeoFRED® to Compare Mean Commuting Time for Workers
This assignment provides instructions on creating the map below and suggests prompts for in-class discussion. See how you do on our sample discussion question below.
Click on the map above to view an interactive version Question: In 2018, which of these two counties reported longer mean commuting times for workers: Cook County, IL (home to the City of Chicago) or Los Angeles County, CA (home to the City of Los Angeles)?
Learning About the Economics of Travel to Forecast Changes in Gross Domestic Product
Travel and tourism contribute to gross domestic product (GDP). Read on for more details and a list of resources to become a better FREDcast forecaster.
BEA Headline:
According to the Bureau of Economic Analysis, “The U.S. outdoor recreation economy accounted for 2.2 percent ($427.2 billion) of current-dollar gross domestic product (GDP) in 2017.”
Quiz Yourself on Different Aspects of the Economics of Travel
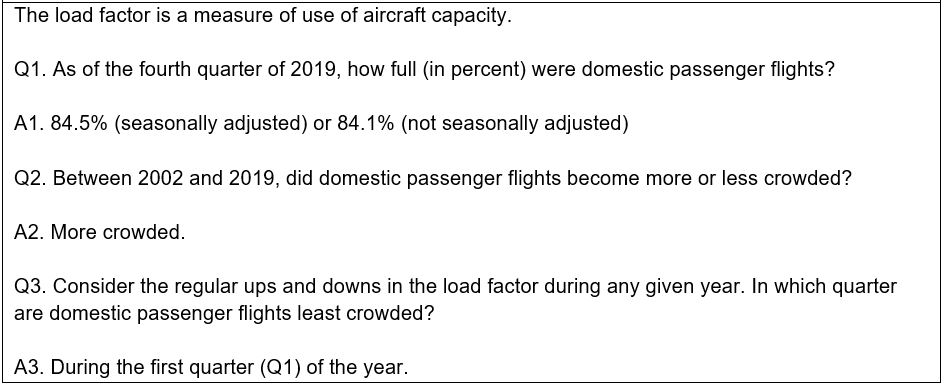
The load factor is a measure of use of aircraft capacity.
Q1. As of the fourth quarter of 2019, how full (in percent) were domestic passenger flights?
Q2. Between 2002 and 2019, did domestic passenger flights become more or less crowded?
Q3. Consider the regular ups and downs in the load factor during any given year. In which quarter are domestic passenger flights least crowded?
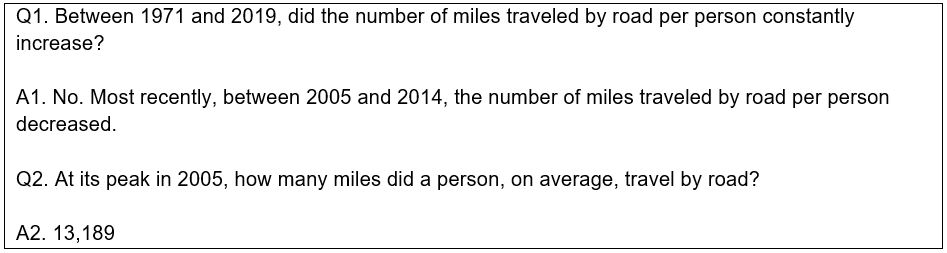
Q1. Between 1971 and 2019, did the number of miles traveled by road per person constantly increase?
Q2. At its peak in 2005, how many miles did a person, on average, travel by road?
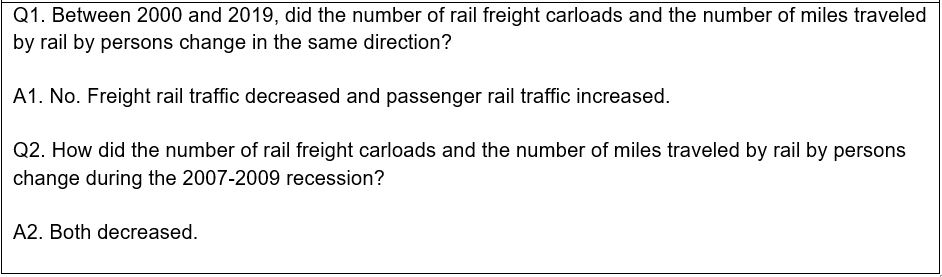
Q1. Between 2000 and 2019, did the number of rail freight carloads and the number of miles traveled by rail by persons change in the same direction?
Q2. How did the number of rail freight carloads and the number of miles traveled by rail by persons change during the 2007-2009 recession?
Now that you’ve aced this quiz, give it to your students using this dashboard. To customize this dashboard, just click the “Save to My Account” button at the top of the dashboard.
FRED has added 118 new series from Indeed, which calculates trends in job postings on Indeed for the U.S., Australia, Canada, Germany, Ireland, and the U.K. For the U.S., indices are calculated for states, for the largest metro areas by population, and by wage tier. Indeed reports how the trends in job postings this year differ from those of last year, focusing on the recent changes in labor market conditions due to COVID-19.
Copyrighted: Pre-approval required. Contact Indeed to request permission to use the data at their contact information provided here.
The Board of Governors discontinued the H.3 statistical release “Aggregate Reserves of Depository Institutions and the Monetary Base” on September 17, 2020.
As a result of the elimination of reserve requirements for all depository institutions (effective March 26, 2020), many of the release items on the Board’s H.3 statistical release are zero. Therefore, the Board consolidated the remaining relevant items from the H.3 statistical release into the H.6 release, “Money Stock Measures.” For more details on this consolidation, see the Board’s announcement posted August 20, 2020, and the Technical Q&As for H.6.
The changes described above have been implemented in FRED. Most of the series from H.3 were discontinued, with the exception of the following monthly series, which were consolidated into Table 1 of the H.6 statistical release: