Learn a little more about how to learn a little more about FRED.
Federal Reserve Economic Data
Announcements
FRED Update: Release Tables and the API
Release tables…? API…? Tell me more!
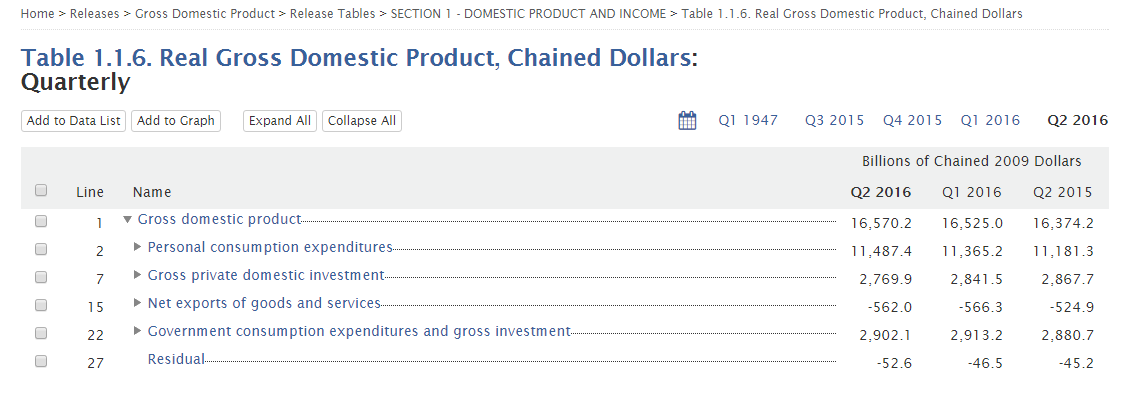
Did you know that FRED has release tables? These detailed lists are great for learning how series are constructed. For example, Table 1.1.6 here shows the components of real GDP:
Links to release tables appear at the bottom of series pages. You can also see a list of them on the main release page. Not all series have release tables yet, but we’re working to make sure every series is connected to at least one release table. So, check back often.
Did you also know that FRED has added release tables to the API? What does that mean, you ask? Well, if you’re building an application and want to pull in the data or the structure of the release table programmatically, we’ve made it easy for you. Learn more here.
Posted in FRED Announcements
Dear Diary: Today in Fed History…
Charles S. Hamlin, the first Chair of the Federal Reserve Board (1914-16), kept handwritten diaries. FRASER has them.
Posted in Research Announcements, Top Story 1
ALFRED Has A New Look (Again)
It seems like only yesterday that ALFRED, our source for vintage data, decided to steal…er…we mean imitate FRED’s look. Well, ALFRED has gone and done it again. So, to repeat ourselves: “If you know how to use FRED to visualize and download the latest data, you know how to use ALFRED to visualize specific vintages of those data.” Here’s an example of a graph showing the recent GDP revisions:
Posted in FRED Announcements
The Housing Market Can Affect Jobs
From Economic Synopses: Areas with large declines in house values also had large declines in employment.
FRED-MD Has Been Updated
The FRED monthly database for macroeconomic research (FRED-MD) now includes the July 2016 vintage. This database, designed for the empirical analysis of “big data,” is described in detail in a St. Louis Fed working paper by Michael W. McCracken and Serena Ng.
Posted in FRED Announcements
FRED Adds 203 Productivity and Costs Series
FRED has added an additional 203 annual and quarterly series from the Labor Productivity and Costs dataset published by the Bureau of Labor Statistics. These data are broken down into business, nonfarm business, nonfinancial corporations, and manufacturing for the United States.
Posted in FRED Announcements
FRED Adds 127 Macroeconomic Series
FRED has added 127 series from the Three Centuries of Macroeconomic Data research project published by the Bank of England. These data cover national accounts and other financial and macroeconomic data in the United Kingdom going back to the late 17th century.
Posted in FRED Announcements
FRED Adds 987 World Development Indicators Series
FRED has added 987 annual World Development Indicators series originally published by the World Bank. The data cover a multitude of indicators spanning from inflation rates to population levels for both individual nations and transnational regions. The information in FRED includes notes that outline which nations are included in the transnational data published and a brief explanation about what the indicators measure.
Posted in FRED Announcements
FRED-MD Has Been Updated
The FRED monthly database for macroeconomic research (FRED-MD) now includes the June 2016 vintage. This database, designed for the empirical analysis of “big data,” is described in detail in a St. Louis Fed working paper by Michael W. McCracken and Serena Ng.
Posted in FRED Announcements