FRED has added 7 series on the Euro Short-Term Rate, or €STR, from the European Central Bank. The Euro Short-Term Rate series are meant to replace EONIA, which is discontinued as of 01/03/2022. The Euro Short-Term Rate series provide information about the wholesale euro unsecured overnight borrowing costs of banks located in the euro area. For further information, refer to this overview of €STR.
Announcements
LIBOR Series Discontinued
The widely used London Interbank Offered Rate (LIBOR) benchmarks are being phased out; in response, FRED will discontinue several related series.
Currently, LIBOR benchmarks are produced by surveying a panel of large international banks on unsecured borrowing rates experienced in wholesale markets. LIBOR benchmarks are provided across seven tenors (overnight/spot next, one week, one month, two months, three months, six months, and 12 months) for five major currencies (USD, GBP, EUR, CHF, and JPY). The average of respondent rates with these tenors and currencies constitute the 35 LIBOR benchmark series.
The current family of benchmarks are being discontinued in favor of alternatives to minimize the potential for manipulation, respond to the decreased liquidity in interbank markets, and use observable transactions where possible. The administrator of the LIBOR benchmarks, ICE Benchmark Administration Limited (IBA), has announced transition guidance. Specifically, the following changes are scheduled for the next few years:
- All Swiss franc and euro LIBOR settings will cease December 31, 2021.
- The overnight, one-week, two-month, and 12-month Japanese yen and British sterling settings will cease December 31, 2021. However, a synthetic methodology will be available through 2022 for the one-month, three-month, and six-month tenors. This methodology will add spread adjustments to the ICE Term SONIA Reference Rate and the Tokyo Term Risk Free Rate for the British sterling and Japanese yen, respectively.
- The one-week and two-month U.S. dollar settings will cease December 31, 2021. The overnight, one-month, three-month, six-month, and 12-month tenors are expected to continue on the current methodology until the end of June 2023. After this time, the one-month, three-month, and six-month settings are expected to continue using a synthetic, unrepresentative methodology.
LIBOR benchmark series in FRED will be discontinued at cessation dates. Recommended alternatives may be found on the Financial Conduct Authority’s LIBOR transition page.
Posted in FRED Announcements
FRED Adds Cleveland Fed’s Inflation Expectations
FRED has added 35 series on expected inflation and real and inflation risk premia from the Federal Reserve Bank of Cleveland. The series are estimates of the expected rate of inflation over the next 30 years along with the inflation risk premium, the real risk premium, and the real interest rate, calculated with a model that uses Treasury yields, inflation data, inflation swaps, and survey-based measures of inflation expectations. See the source’s FAQs for more details about the data and methodology for the calculations.
Posted in FRED Announcements
Teaching the Composition Effect| Bring FRED into the Classroom | November 2021
Focus on the Headline Unemployment Rate
This lesson plan explains why the composition effect makes it difficult to describe diverse populations with a single statistic. It provides instructions on building the graph below and includes prompts for both in-class and out-of-class assignments.
Storytelling with Data and FRED Interactive Modules

Data Citations: Learn how to use FRED® to create good data citations. The FRED Interactive modules can be embedded in your learning management system.
Quiz Yourself on the Composition Effect
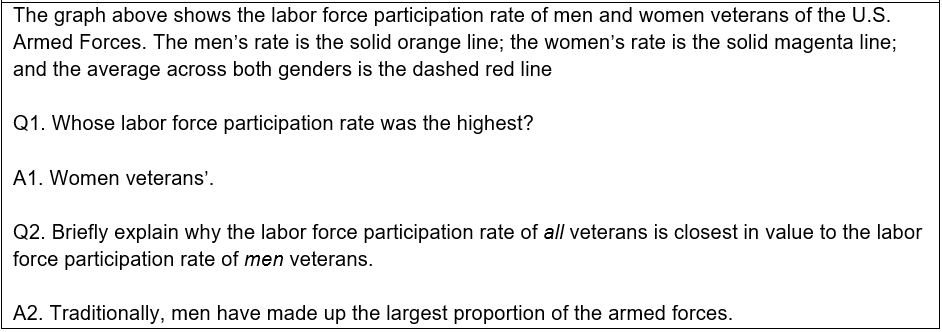
The graph above shows the labor force participation rate of men and women veterans of the U.S. Armed Forces. The men’s rate is the solid orange line; the women’s rate is the solid magenta line; and the average across both genders is the dashed red line
Q1. Whose labor force participation rate was the highest?
Q2. Briefly explain why the labor force participation rate of all veterans is closest in value to the labor force participation rate of men veterans.
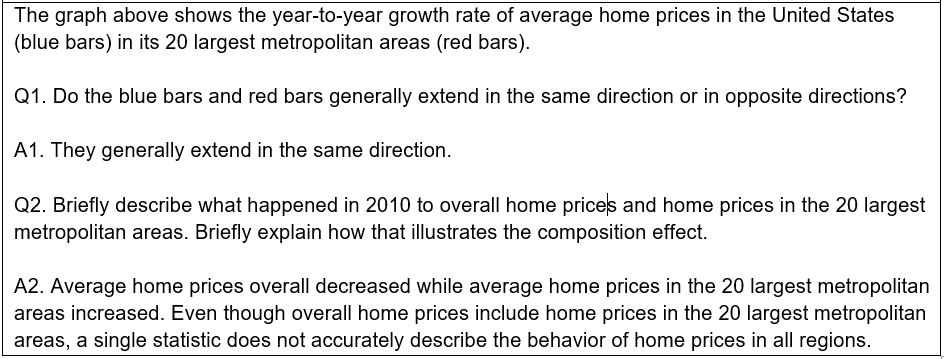
The graph above shows the year-to-year growth rate of average home prices in the United States (blue bars) in its 20 largest metropolitan areas (red bars).
Q1. Do the blue bars and red bars generally extend in the same direction or in opposite directions?
Q2. Briefly describe what happened in 2010 to overall home prices and home prices in the 20 largest metropolitan areas. Briefly explain how that illustrates the composition effect.
You can share these graphs with your students using this dashboard. To customize this dashboard, just click the “Save to My Account” button at the top of the dashboard.
Posted in FRED Classroom Newsletter
FRED Adds EONIA: Euro Interbank Offered Rate
FRED has added the European Overnight Index Average (EONIA), which is the closing rate for overnight loans denominated in euros. To create this series, the European Central Bank (ECB) collects data on unsecured, overnight lending among a panel of banks in the euro area.
Posted in FRED Announcements
Teaching the Economics of Innovation | Bring FRED into the Classroom | September 2021
Focus on Royalties and License Fees
This assignment provides instructions on building the graph below and includes writing prompts for out-of-class assignments.
Using GeoFRED® to Compare Granted Patents Across States
This assignment provides instructions on creating the map below and suggests prompts for in-class discussion. See how you do on our sample discussion question below.
Click on the map above to view an interactive version.
Question: Name three states with more than 10,000 granted patents during 2019. Don’t overlook Hawaii and Alaska!
Storytelling with Data and FRED Interactive Modules

Doing Basic Math: Learn how to use several FRED® features for transforming and visualizing data and apply basic mathematical formulas to the data. The FRED Interactive modules can be embedded in your learning management system.
Quiz Yourself on the Economics of Innovation
Q1. Between 1992 and 2020, which was the most frequently granted type of patent in the U.S.?
Q2. Between 1992 and 2020, which was the second-most frequently granted type of patent in the U.S.?

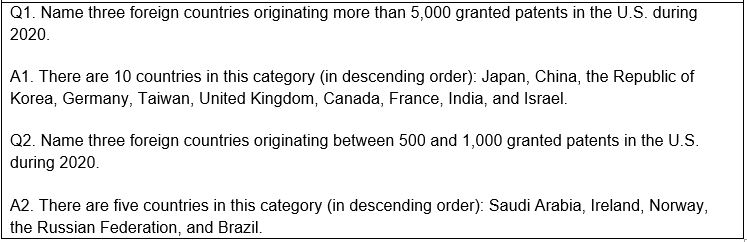
Click on the map above to view an interactive version.
Q1. Name three foreign countries originating more than 5,000 granted patents in the U.S. during 2020.
Q2. Name three foreign countries originating between 500 and 1,000 granted patents in the U.S. during 2020.
Q1. In 1992, which country originated the largest number of granted patents in the U.S.?
Q2. In 1992, which country originated the second-largest number of granted patents in the U.S.?
Q3. In 2020, which country originated the second-largest number of granted patents in the U.S.?

Now that you’ve aced this quiz, give it to your students using this dashboard. To customize this dashboard, just click the “Save to My Account” button at the top of the dashboard.
Posted in FRED Classroom Newsletter
FRED Adds Chicago Fed Advance Retail Trade Summary (CARTS) Indexes
FRED has added four weekly series on retail trade from the Federal Reserve Bank of Chicago. The Chicago Fed Advance Retail Trade Summary (CARTS) is a weekly index designed to track the Census Bureau’s Monthly Retail Trade Survey (MRTS).
Posted in FRED Announcements
Teaching Productivity | Bring FRED into the Classroom | August 2021
Focus on Real Output per Hour Worked
This assignment provides instructions on building the graph below and includes writing prompts for out-of-class assignments.
Using GeoFRED® to Compare Labor Productivity Growth Across States
This assignment provides instructions on creating the map below and suggests prompts for in-class discussion. See how you do on our sample discussion question below.
Click on the map above to view an interactive version.
Question: Name the state with the highest labor productivity growth during 2020. Don’t overlook Hawaii and Alaska!
Storytelling with Data and FRED Interactive Modules

Index Numbers: Learn how to use several FRED® features to use index numbers to measure growth in prices: changing the data units and applying a formula to the data. The FRED Interactive modules can be embedded in your learning management system.
Quiz Yourself on Productivity
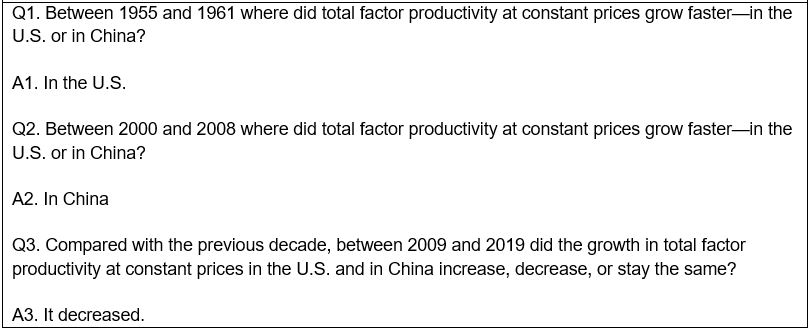
Q1. Between 1955 and 1961 where did total factor productivity at constant prices grow faster—in the U.S. or in China?
Q2. Between 2000 and 2008 where did total factor productivity at constant prices grow faster—in the U.S. or in China?
Q3. Compared with the previous decade, between 2009 and 2019 did the growth in total factor productivity at constant prices in the U.S. and in China increase, decrease, or stay the same?
Q1. Between 1988 and 2008 where did labor productivity grow faster—in the durable or in the non-durable manufacturing sector?
Q2. Compared with the years between 1988 and 2008, between 2009 and 2019 did labor productivity in both durable and non-durable manufacturing increase, decrease, or stay the same?

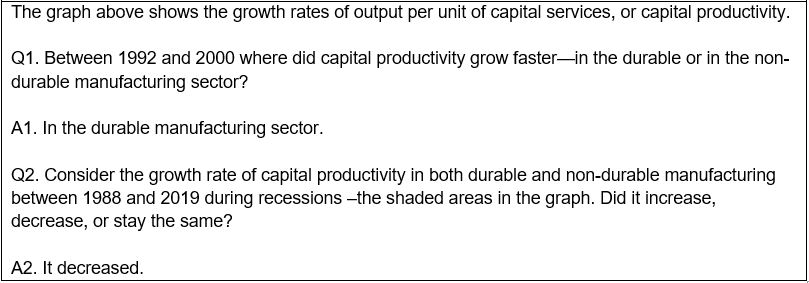
The graph above shows the growth rates of output per unit of capital services, or capital productivity.
Q1. Between 1992 and 2000 where did capital productivity grow faster—in the durable or in the non-durable manufacturing sector?
Q2. Consider the growth rate of capital productivity in both durable and non-durable manufacturing between 1988 and 2019 during recessions –the shaded areas in the graph. Did it increase, decrease, or stay the same?
Now that you’ve aced this quiz, give it to your students using this dashboard. To customize this dashboard, just click the “Save to My Account” button at the top of the dashboard.
Posted in FRED Classroom Newsletter
FRED Adds SONIA Interest Rate Benchmarks
FRED has 13 new series of overnight interest rate data from the Bank of England. Banks pay the sterling overnight index average (SONIA) on top of any loans made for purchases of sterling (British pounds) in the overnight market. Because SONIA is based on the average of these overnight interest rates without incorporating risk premiums, it is also effectively risk free. This is a departure from the London interbank offered rate (LIBOR), which is still short-term lending but more forward looking; since LIBOR includes loans up to one year in duration, risk premiums are built into some of its loans. LIBOR historically has been used by the private sector as a benchmark for short-term interest rates; but as the Bank of England phases out LIBOR this year, SONIA will take its place as a more robust and stable benchmark.
Posted in FRED Announcements
FRED Adds the Interest Rate on Reserve Balances
Effective July 29, 2021, the Board of Governors of the Federal Reserve System will replace the interest rate on excess reserves (IOER) and the interest rate on required reserves (IORR) with a single rate, the interest rate on reserve balances (IORB). Therefore, FRED has discontinued the IOER and the IORR rates and added the IORB rate. See the Board’s announcement for more details.
The IORB rate is the rate of interest that the Federal Reserve pays on balances maintained by or on behalf of eligible institutions in master accounts at Federal Reserve Banks. The interest rate is set by the Board of Governors, and it is an important tool of monetary policy. See Policy Tools and IORB FAQs for more information.
Posted in FRED Announcements